My Tools
These are my tools that I have developed over time to help explain and explore the key tools and methodologies that drive the Omniunify framework, enabling the modelling, analysis, and visualization of complex interconnected systems. These innovative techniques—ranging from digital hashing and data compression to multidimensional fuzzy logic and graphical representations—are designed to unravel intricate relationships between variables, known as Xuzzies, within the Omniunify construct. By leveraging advanced mathematical, logical, and graphical methods, these tools provide insights into patterns, trends, and cause-and-effect dynamics, offering a comprehensive understanding of the interconnected universe modelled by Omniunify.
Digital Hash (DCTNolanomics)
DCTNolanomics is a sophisticated tool within the Omniunify framework, designed to process metadata and generate predictions, trends, and unique compressed representations of complex datasets. Unlike traditional Boolean logic, it employs parametric values combined with advanced mathematical techniques, such as sine, cosine, and prime number constants, to create unique digital fingerprints. This innovative approach enables highly detailed modelling, data compression, and pattern recognition, making it an invaluable tool for understanding and predicting complex relationships in Omniunify datasets.
Purpose
To take values stored as metadata within the Omni-repository and produce a prediction and an indication of trends in the data. It also compresses a string of values into a single representation value for highly complex modelling.
Description
This tool functions like Boolean logic but uses parametric rather non parametric values. In Boolean algebra, results are limited to binary values (1 or 0). DCTNolanomics, however, applies sine and cosine to a sequence, along with prime number constants, to create unique values. This produces a “digital fingerprint” that isn’t limited to binary but can work with more complex number scales. In traditional math, the order of values doesn’t change the sum (e.g., 1 + 2 + 3 = 6), but in DCTNolanomics, the order alters the result, creating multiple unique values. This method is used for distance-preserving digital hashing, helpful in modelling, profiling, and AI pattern recognition. It also generates a data compression factor, so trends and variables within the datasets can be represented by a single unique value which represents a number of observations by value and position.
Capstone
Capstoning is a transformative data processing technique within the Omniunify framework, designed to compress and reshape datasets while preserving their relational structure. By leveraging DCTNolanomics and peer relativity reshaping, it assigns unique digital fingerprints to grouped variables, ensuring both efficient data compression and accurate representation. This innovative method plays a critical role in modelling Omniunify events by identifying patterns and relationships within and across datasets.
Purpose
The purpose of capstoning is combine the data transformation of peer relativity (a nearest neighbour approach to its position within and between variables, and a distance preserving digital hash to uniquely identify and represent the peer relativity across the dataset. This is used on any data which is associated with an event that Omniunify is modelling.
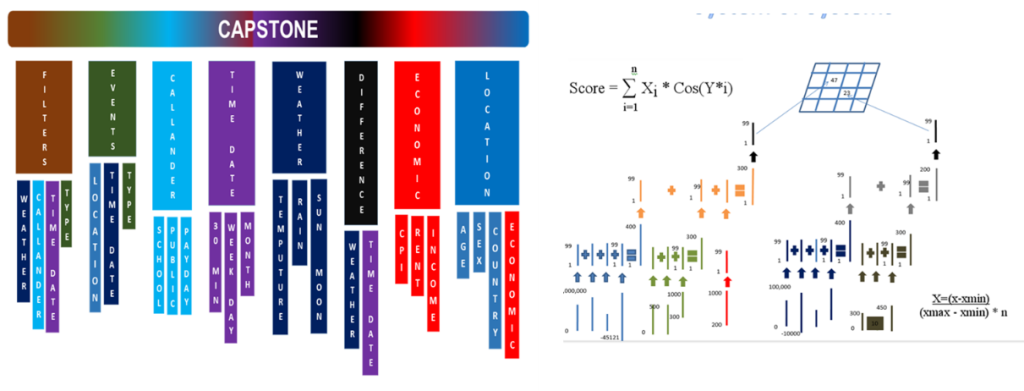
Description
Capstone is a tool that uses DCTNolanomics and “peer relativity reshaping” to compress data into an enhanced dataset. It groups similar variables together, assigning a relative position to each value (the highest is set to 53, the lowest to 1). These values are then reshaped and combined using DCTNolanomics to create a “digital fingerprint” for each data group. This process compresses data and can be repeated multiple times as needed.
Deep Fuzzy Logic Predictive Averages
Deep Fuzzy Logic Predictive Averages is a powerful analytical tool within the Omniunify framework, designed to identify trends and forecast future outcomes. By leveraging fuzzy logic, advanced observation comparisons, and AI-driven decision trees, this tool provides a comprehensive approach to analyzing data. Integrated with Capstone, it enables a high-level understanding of Omnisignatures, offering valuable insights into the interconnected dynamics of the Omniunify construct.
Purpose
This tool takes data from Omniunify events and using windowing and fuzzy logic, to model trends and predict future values of specific variables.
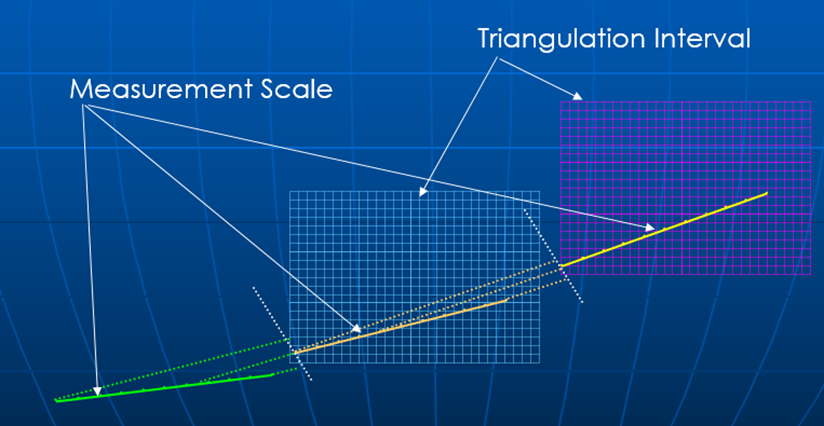
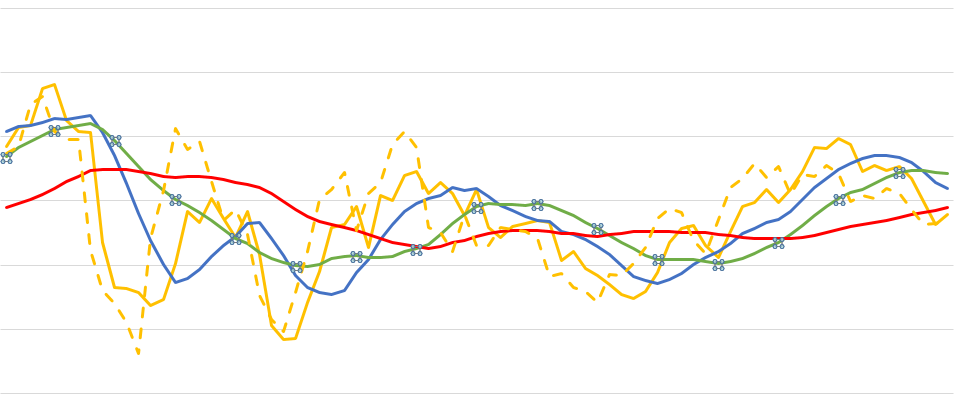
Description
This tool compares 14 observations within a fuzzy set and produces a series of “average” lines through multiple cycles. Each observation’s difference is measured relative to its neighbours, and the tool calculates ratios between all lines. These ratios are then analysed by an AI decision tree to identify patterns. When combined with Capstone, this provides a big-picture view of Omnisignatures at a high level.
Nolan’s Matrix
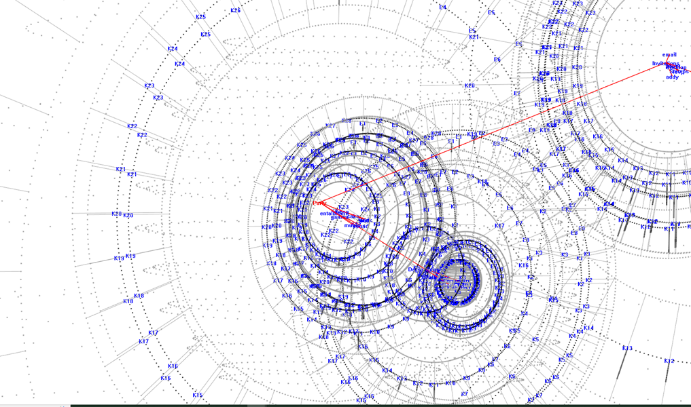
Nolan’s Matrix is a visualization and analysis tool within the Omniunify framework, designed to map and evaluate the interactions between Xuzzies. By comparing variables and assigning ratings to their positive and negative impacts, the matrix generates insightful graphical representations. These visual outputs, including dendrograms and topographic-style maps, enable users to identify and interpret clusters of stratified relationships, providing a dynamic view of how Xuzzies influence one another across the Omniunify construct.
Purpose
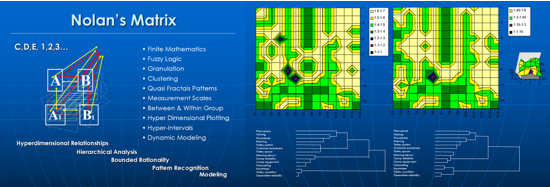
The matrix helps to visualise and group Omniunify Xuzzies into a contour map of positive and negative effects between Xuzzies. When these dendrogram and maps are positioned side by side, you can easily detect and compare the clusters of stratifications, by their colour and connections represented in the paired charts.
Description
Nolan’s Matrix compares variables against each other, showing both positive and negative impacts. For each variable pair, it assigns ratings (e.g., very low, low, average, high, very high) to both positive and negative outcomes. The matrix helps map out how variables in the Xuzzy system affect each other. Two visual outputs are generated:
There are two graphical displays used in this tool. The first is a dendrogram, which looks like a decision tree bur is computed and charted from branches to trunk, rather than a decision tree which is trunk to branches. The branches are also different sizes and shapes which illustrate the distance between them, unlike a decision tree where the length of the branches is purely for ascetic reasons. The branches are also chained in clusters which cascade from the tip of the branch, through many junctions back to the trunk. The second graphic is a like a surface or topographic map. Rather than representing the physical features like hills and valleys, this represents a data landscape where high points represent strong positive interactions (mountains), and low points represent strong negative interactions (valleys). So the end result when the variables are ranked, is a 2d and 3d map of nearest neighbour clusters.
Knowledge Nets
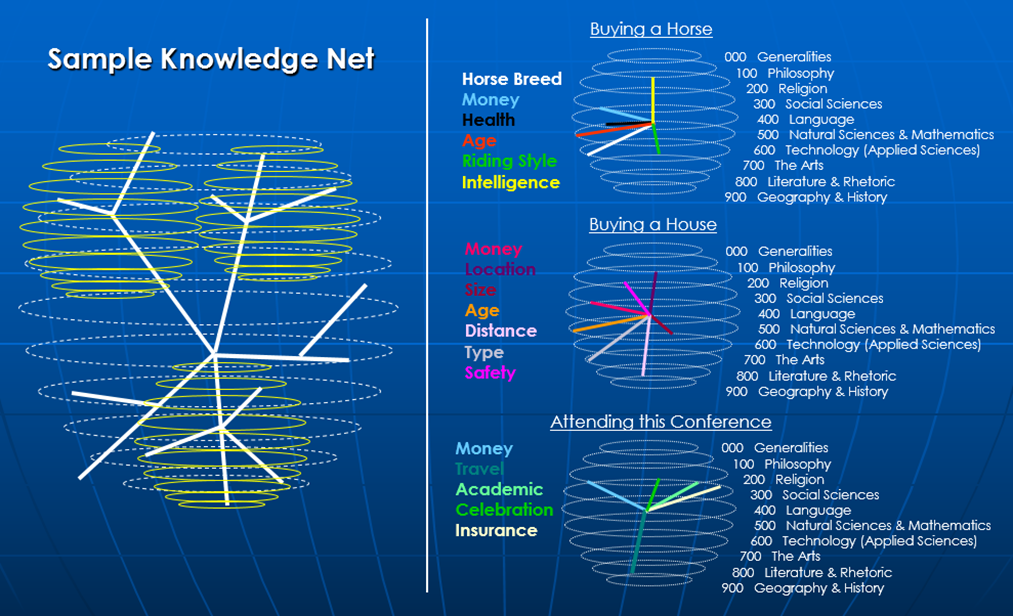
Xuzzy Relativity Mapping is a visual and analytical tool designed to depict the relationships, cause-and-effect dynamics, and connections between Xuzzies in a cartographic style. By employing a classification system similar to the Dewey Decimal System, it translates knowledge into geometric graph plots. These star graphs and radial diagrams provide both visual and mathematical insights, illustrating the contribution, impact, and connections of Xuzzies within the Omniunify construct. This method enables a deeper understanding of event interrelations and knowledge structures.
Purpose
Is to show the relativity, cause & effect, and connections between Xuzzies, in cartography style patterns to allow for visual and mathematical comparisons between events.
Description
By using a library classification system like Dewey Decimal which assigns a piece of knowledge a notation number, lends itself to geometric graph plots. These plots position a word encased in a circle/sphere at a specific distance from the centre, which represents the degree of contribution to the Xuzzy. The direction of the line from the centre of the sphere to the set coordinates to the outer edge, represents the area of knowledge. The circle/sphere is a star graph which the radials represent the impact of activity of the Xuzzy contributes. The angle and distance of the positions between spheres demonstrates the cause and effect constructs that define the connections.
Deep Fuzzy Logic
The purpose of Deep Fuzzy Logic is to model, analyze, and calculate the proportional influence of interconnected variables across multi-dimensional datasets. By incorporating intra-relativity, inter-relativity, and symbiotic-relativity, this approach allows for precise representation and prediction of trends, ensuring that the total influence within any system sums to 1. This proportional balance aids in visualizing and understanding complex systems in Omniunify’s interconnected construct.
Purpose
The purpose of Deep Fuzzy Logic is to analyze and model the proportional influence of interconnected variables across multi-dimensional spaces. It ensures that each Xuzzy’s total influence sums to 1 while dynamically distributing its contributions across primary and secondary memberships, capturing the complexities of intra-, inter-, and symbiotic-relativity within the Omniunify framework.
Description
Deep Fuzzy Logic applies fuzzy logic principles in an n-dimensional space, allowing for the representation of intricate relationships between Xuzzies. Each Xuzzy dynamically distributes its influence across memberships, creating a proportional system where the total influence remains balanced. This approach enables a comprehensive understanding of how individual components interact within a highly interconnected system.